
Day 2 of working with Houdini fracturing. Found a good basic tutorial for Voronoi fracturing. This approach combines the best of both worlds, pre-fracturing AND dynamic fracturing.
This is the final output from the dynamic fracturing:
Below is kind-of flip-book of the simulation. I am working on a Linux system, so can't really take screen-captures and can't be bothered to render out the sequence.


The basic problem I face when doing destruction is that I am faced with two choices. First is that I can pre-fracture stuff and just apply RBD on to the pieces and live happily ever after. However, the problem with the approach is that as I am painting the fracture or creating it procedurally, it either looks contrived or looks too uniform and artificial. The pro being that it is much faster and easier to control. Second option is doing a dynamic fracture. This is physically more accurate, so gives a better looking result. However, the problem with this approach is speed. Every time a parameter is changed, you need to re-run the sim and wait to see how the result looks like.
This approach that I found tonight is a good mid-way between the two. We get the pre-visualisation power from the pre-fracturing we do and the accuracy from the dynamic fracturing. It might not be a major invention and might just be a standard industry practice, but it is definitely very interesting for me :)
How this works is that we build a very simple network using SOPs. First of all we take the geometry we want to fracture. In this case it is a sphere, with a mountain SOP appended to it giving the look of a rock.
Next, a scatter node is attached to it and 1 point is placed on the mesh. This gives us an impact point. This information, along with the base geometry is passed on to the voronoifracturepoints SOP. This SOP adds several parameters to the geometry passed down to it.
The above picture is the output of the voronoifracturepoints SOP. The sphere represents the impact radius. The yellow points are the fracture points ON the surface, the red points represent the interior points and the blue points are the back-faces.
The output of this SOP is passed on to the voronoifracture SOP. Here we can visualise the fracturing.
I then played with a few attributes till I got the look I was looking for. This was the result I got in the end. Notice that this has much more size variation than before. Now there are some small pieces which will form the fine debris that lends believability to the scene.
After visualising the exterior, I appended an explodedview SOP that helps visualising the interior geometry.
The explodedview SOP is an important part of the visualisation process. Below are some results from the SOP.


A thing to notice is that the main chunk of the rock is still intact. This is achieved by turning on 'clustering'. Once inside the fractured geo, I turned on 'add interior detail' and also the 'visualise noise scale' option. This gave me a visualisation of how the noise impacted the interior pieces. Red areas are maximum scale and blue areas are minimum scale.
Once this pre-visualisation was done, I created a DOP net, simulated the rock falling and hitting the ground plane and made it breakable. Then I created relative references between the voronoifracture and voronoifracturepoints SOPs and fractureparms node in the DOP network.
By doing this, I got a result very close to my visualisation, but I still had the option to fracture dynamically and add steps, multiple fracturing etc.
Also, the relative references to the SOP level are good as if we need to change our result, we can go back to the SOPs, re-visualise and the DOP will update in a relatively controlled way.
Below are the snapshots from two scenarios for comparison. Notice that the pre-vis is very close to the dynamic fracture.
That was a LONG post, but I enjoyed explaining the process and hopefully someone will find ii useful if they are stuck with this stuff. It will definitely help me in a week, when I forget how I managed to do this :p
Here are some more pretty pictures. Enjoy :)


 |
| Pre-Visualising dynamic fracturing |
This is the final output from the dynamic fracturing:
 |
| Final output of the dynamic fracture |
Below is kind-of flip-book of the simulation. I am working on a Linux system, so can't really take screen-captures and can't be bothered to render out the sequence.


The basic problem I face when doing destruction is that I am faced with two choices. First is that I can pre-fracture stuff and just apply RBD on to the pieces and live happily ever after. However, the problem with the approach is that as I am painting the fracture or creating it procedurally, it either looks contrived or looks too uniform and artificial. The pro being that it is much faster and easier to control. Second option is doing a dynamic fracture. This is physically more accurate, so gives a better looking result. However, the problem with this approach is speed. Every time a parameter is changed, you need to re-run the sim and wait to see how the result looks like.
This approach that I found tonight is a good mid-way between the two. We get the pre-visualisation power from the pre-fracturing we do and the accuracy from the dynamic fracturing. It might not be a major invention and might just be a standard industry practice, but it is definitely very interesting for me :)
How this works is that we build a very simple network using SOPs. First of all we take the geometry we want to fracture. In this case it is a sphere, with a mountain SOP appended to it giving the look of a rock.
 |
| The pre-visualisation pre-fracturing network |
 |
| The base geometry |
Next, a scatter node is attached to it and 1 point is placed on the mesh. This gives us an impact point. This information, along with the base geometry is passed on to the voronoifracturepoints SOP. This SOP adds several parameters to the geometry passed down to it.
 |
| voronoifracturepoints SOP adding fracture points to the geo |
The above picture is the output of the voronoifracturepoints SOP. The sphere represents the impact radius. The yellow points are the fracture points ON the surface, the red points represent the interior points and the blue points are the back-faces.
The output of this SOP is passed on to the voronoifracture SOP. Here we can visualise the fracturing.
 |
| Creating fractures using fracture points |
 |
| Voronoi pre-fracturing |
I then played with a few attributes till I got the look I was looking for. This was the result I got in the end. Notice that this has much more size variation than before. Now there are some small pieces which will form the fine debris that lends believability to the scene.
 |
| Tweaking the parameters to get the desired look |
After visualising the exterior, I appended an explodedview SOP that helps visualising the interior geometry.
 |
| The GL view showing the interior after appending the explodedview SOP |
The explodedview SOP is an important part of the visualisation process. Below are some results from the SOP.


A thing to notice is that the main chunk of the rock is still intact. This is achieved by turning on 'clustering'. Once inside the fractured geo, I turned on 'add interior detail' and also the 'visualise noise scale' option. This gave me a visualisation of how the noise impacted the interior pieces. Red areas are maximum scale and blue areas are minimum scale.
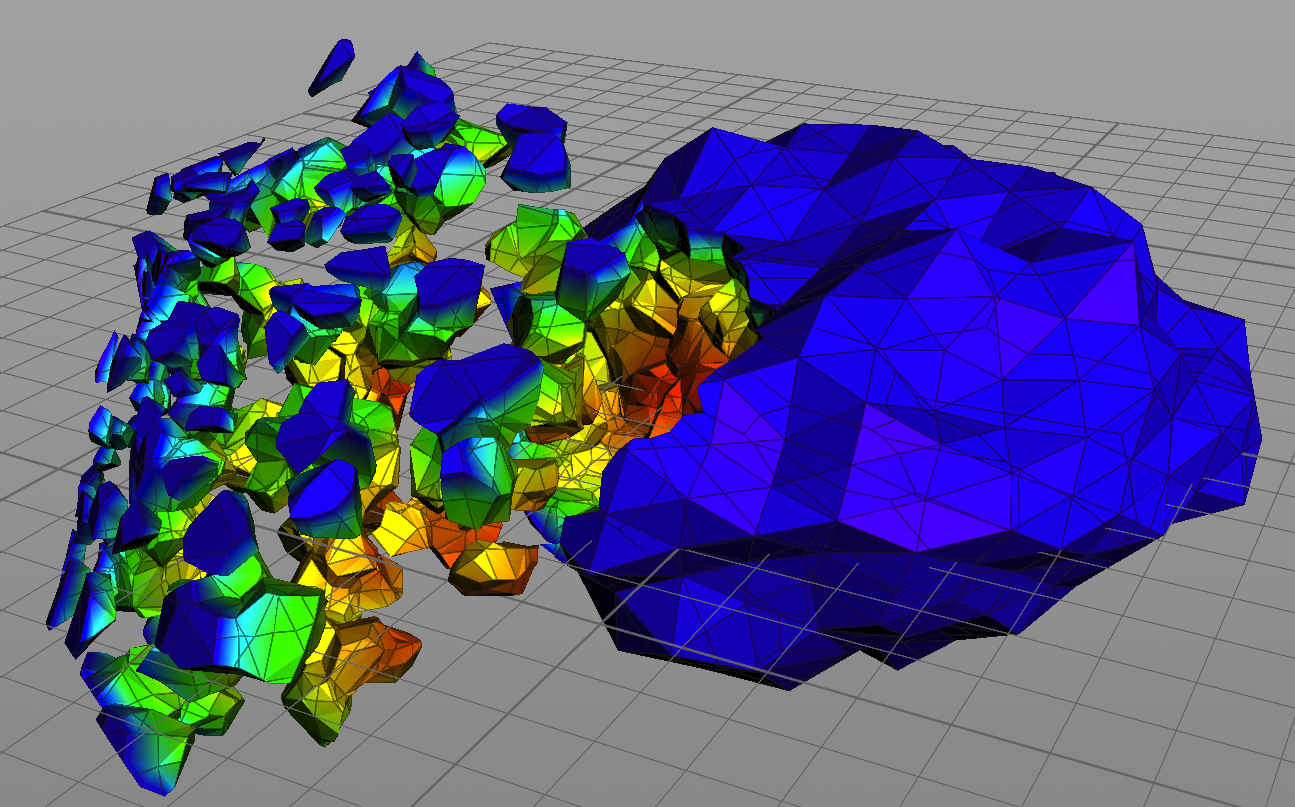 |
| Visualising the interior details using noise scale option |
Once this pre-visualisation was done, I created a DOP net, simulated the rock falling and hitting the ground plane and made it breakable. Then I created relative references between the voronoifracture and voronoifracturepoints SOPs and fractureparms node in the DOP network.
By doing this, I got a result very close to my visualisation, but I still had the option to fracture dynamically and add steps, multiple fracturing etc.
Also, the relative references to the SOP level are good as if we need to change our result, we can go back to the SOPs, re-visualise and the DOP will update in a relatively controlled way.
Below are the snapshots from two scenarios for comparison. Notice that the pre-vis is very close to the dynamic fracture.
 |
| Pre Visualisation |
|
| The result of the dynamic fracturing |
That was a LONG post, but I enjoyed explaining the process and hopefully someone will find ii useful if they are stuck with this stuff. It will definitely help me in a week, when I forget how I managed to do this :p
Here are some more pretty pictures. Enjoy :)


No comments:
Post a Comment